The AIM ⁄ ENDUSE Model and
Case Studies in Japan
Mikiko Kainuma, Yuzuru Matsuoka, Tsuneyuki Morita
National Institute for Environmental Studies, Onogawa, Tsukuba, 305-0053, Japan
Kyoto University, Yoshida-Honmachi, Sakyo-ku, Kyoto, 606-8541, Japan
1 Introduction
Global warming has great impact on the world socio-economy, and it is expected that countermeasures against it will impose a heavy economic burden. It is the same for the Asian-Pacific region, and to promote countermeasures against global warming in this region, it is necessary to predict the amount of greenhouse gases emitted or absorbed by each country and the effects resulting from the introduction of measures to mitigate emissions. To predict and judge these issues, the development of a universal simulation model is indispensable.
The AIM model (Asian-Pacific Integrated Model) estimates the emission and absorption of greenhouse gases in the Asian-Pacific region and judges the impact they have on the natural environment and socio-economy. It aims to contribute to policymaking against global warming and its evaluation.
2 The Basic Structure of AIM
A Tripartite Structure
AIM is an integrated model that can analyze the process chain of greenhouse gas emission, climate change, and its impact. This universal model can make an integrated assessment of each kind of countermeasures against global warming, since it can examine not only the socio-economy of each country and region in relation to climate change, but also what kind of influence climate change have on such socio-economy.
As shown in Figure 1, the complete structure of AIM is made up of a greenhouse gas emissions model (AIM/emission) that forecasts the amount of anthropogenic greenhouse gas emissions, a warming phenomenon model (AIM/climate) that forecasts the concentration of greenhouse gases in the atmosphere and estimates the temperature increase, and a warming impact model (AIM/impact) that estimates the influence that climate change has on the natural environment and socio-economy of the Asian-Pacific region.

Top-Down, Bottom-Up
The greenhouse gas emissions model is made up of models of social and economic activities that become the origin of greenhouse gas emissions through energy consumption, changing land use, and agricultural and industrial production. At its heart lies the energy model, and as Figure 2 shows, it is made up of a World Model as well as Country-specific Models for the Asian-Pacific region. The World Model is a top-down model that uses economic indices based on prices and elasticity to express the connection between energy consumption and production. The country-specific model is a bottom-up model that focuses on the activities of the people who deal with industrial production and the consumption of energy as well as the change in the technology used in these countries and forecasts from these detailed descriptions the total energy consumption and production .

For a long-term forecast, a top-down world model based on market equilibrium that forecasts world economic activity and change is indispensable. Likewise, to explain the exact direction of policy and its effects to policymakers and politicians, a detailed and persuasive bottom-up model is essential.
3 Outline of the AIM/End-Use Model
Aiming at Simulating Individual Energy Processes
Bottom-up models have so far been developed in two directions. One is a model for analyzing more efficient technologies and combinations by focusing on the supply and conversion side of energy. The other one, commonly known as "end-use model", is a model focusing on energy demand and consumption side that sums up details about how changing patterns of human activity in each sector change the energy demand.
We need a lot of energy service in our daily life. Included in it are the production of steel, cement, and plastic, cooling and heating, lighting, and transportation as well as steam and electricity that are used to produce such energy service. Technologies such as blast furnaces, air conditioners, and automobiles offer energy services by using energy such as oil, coal, and gas.
As shown in Figure 3, the AIM/end-use model first estimates energy service demands based on socio-economic factors such as population, economic growth, industrial structure, and lifestyle, and then calculates what kind of technology will be used to what extent. To compare and consider energy technologies, detailed technological data and energy data are prepared. Once the kind of energy technology to be used is known, the model calculates the energy necessary to provide the energy services and the amount of CO2 emissions produced when each type of energy technology operates.

How is the Technology in the Model Selected?
For example, let us consider heating a room. There are a number of technologies like air conditioners and oil and gas stoves for heating a room. But which technology is selected for heating in reality? There are a number of criteria for selection. This model selects a technology on the basis of cost. In this case, the method of evaluation differs depending on whether the technology to offer heating service is already at hand or not.
Costs consist of fixed costs and maintenance costs such as fuel costs. Fuel costs accrue continuously every year, but fixed costs are necessary only at the time when one buys the machine. Since one uses the energy technology for a number of years, one looks at the future and compares prices when one considers the introduction of technology. As shown in Figure 4, there are two ways of making this comparison.

When one does not have a technology, or when the time has come to change a technology one already has, one includes the introduction costs and chooses the cheapest technology. If one already has a technology and the time to change it has not come yet, one looks at the operating costs of the old technology and the sum of the costs of introducing, or upgrading the old technology to, the new technology one is thinking of and its operating cost. One replaces the old technology or upgrades it when the operating costs become less to an extent that compensates for the introduction costs.
4 The Special Features and Limitations of the AIM/End-Use Model
Detailed Reproduction of Technology Substitution
To decrease CO2 emissions, it is key what kind of energy-saving technology one can introduce to what extent from an end-use point of view. The AIM end-use model focuses on the fact that substitution technology will be available according to energy price fluctuation and estimates energy efficiency and energy consumption on the basis of each technology. Therefore, it is possible to evaluate the effectiveness of each policy or combined various policies.
No Guarantee for General Equilibrium
However, the end-use model has some limitations. The first is that so far it is not linked to a top-down economic model, so energy service demand is provided by scenarios. Thus, it cannot estimate macroeconomic losses because it does not take into account direct effects of higher prices in controlling energy demand and indirect economic effects through suppression of consumption or reduction of savings. A second problem is that since it does not consider social costs, such as institutional obstacles, while selecting technologies, it might overestimate the reduction of CO2 emissions caused by each technology. A third is that it might underestimate the overall CO2 emissions reduction potentials, because technologies such as those currently not available are not included. Some of these limits arise from the inherent restrictions of the end-use model, as well as the model being still under development. Thus, it is necessary to take these points into considerations when interpreting the results of this research. However, even with these limitations, this model is superior as a tool for judging the effects of each policy options or joint effects of various policies, in terms of its practicality and policy supporting mechanisms, than normal economic models that persist on reproducing economic paradigms.
5 The Structure of the End-Use Model
Five Sectors and 200 Technologies
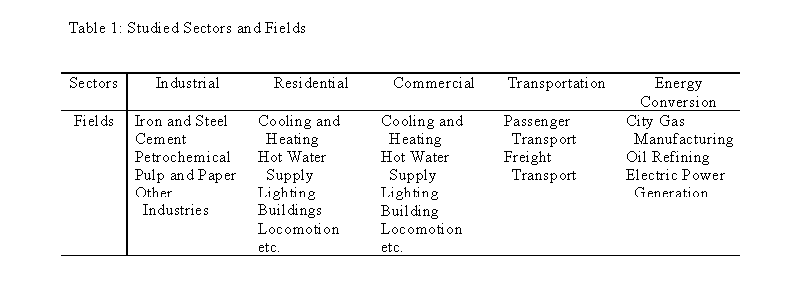
Table 1 shows the sectors and fields that were used for forecasting Japanese CO2 emissions. Energy service and technology selection for each sector and field are decided so that energy consumption and CO2 emissions can be estimated. For this purpose, energy service demands are estimated based on socio-economic data. Next, basic data such as introduction cost, energy consumption per unit and lifetime for almost 200 kinds of energy technologies are collected and included in a database. Fuel prices and CO2 emission factors are also stored. Although limestone is not used as a fuel, it is included in the analysis because it causes CO2 emissions while being used as a raw material in the cement industry and to remove impurities in the steel production process.
Deciding the Most Suitable Energy Consumption
Based on these premises and data, the AIM end-use model estimates energy consumption and CO2 emissions in the following way:
- It calculates the amount of energy service (the demand for manufacturing of products, transport, and air-conditioning, etc.) using scenarios and models.
- It selects the service technology to meet this service demand.
- It calculates the amount of energy necessary for the operation of the technology.
- It estimates the amount of CO2 emissions on the basis of energy consumption by fuel type as determined above.
The most important judgment made in this procedure is that of selecting service technologies. Since the technology selection process is programmed in, technology selection changes when a carbon tax or subsidies are introduced, and as a consequence, the energy consumption and amount of CO2 emissions change as well. For example, when one introduces a carbon tax, the price of energy increases, and because of this, the amount saved by not using as much fuel increases, and as a result, one can introduce relatively expensive energy-saving technologies. Similarly, if the initial cost of energy-saving technology decreases due to the introduction of a subsidy, the introduction of that technology will be promoted.
6 Case Studies in Japan
Anticipated Structural Change
When one looks at the long-term period, that is the first half of the next century, one must not forget that there is great uncertainty regarding change of the social structure such as population. For example, the Japanese population will reach a peak in 2010 and then decrease. In addition, the majority of the post-war baby boom generation will move toward retirement around that time. It is possible that such changes will greatly change the life style of the people and the direction of economic development. Furthermore, if economy continues to become global in the next century, China and other countries will reach the economic standard of Japan in the 1970s by 2030. As a result, one can easily predict that the industrial structure of Japan will change greatly. On the other hand, we predict that wide-spread environmental impacts, such as acid rain from the burning of coal in China, will become apparent in East Asia in the beginning of the next century. Therefore, it is very likely that the investment for countermeasures against environmental pollution will increase at a breath and the cost for these technology will decrease very quickly.
This kind of structural change will have great impact on the amount of CO2 emissions. However, the degree of this change is a great uncertainty. For this reason, a perspective that incorporates this uncertainty is necessary.
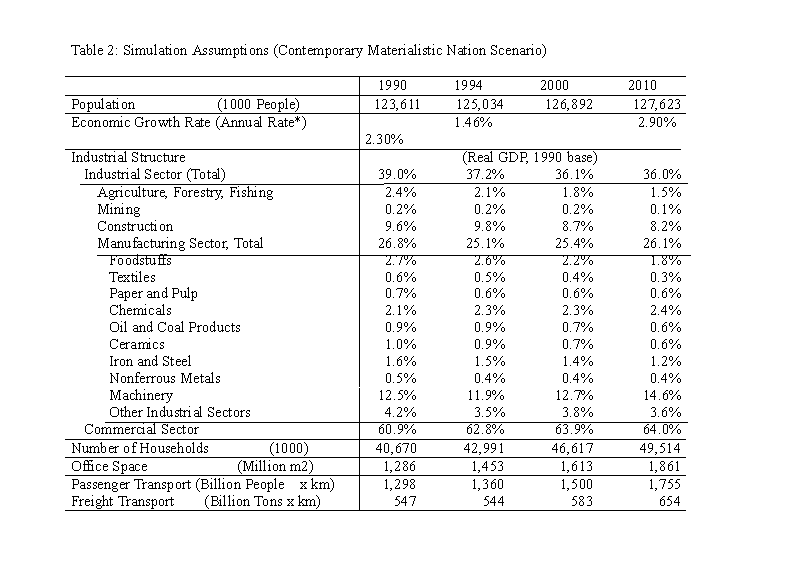
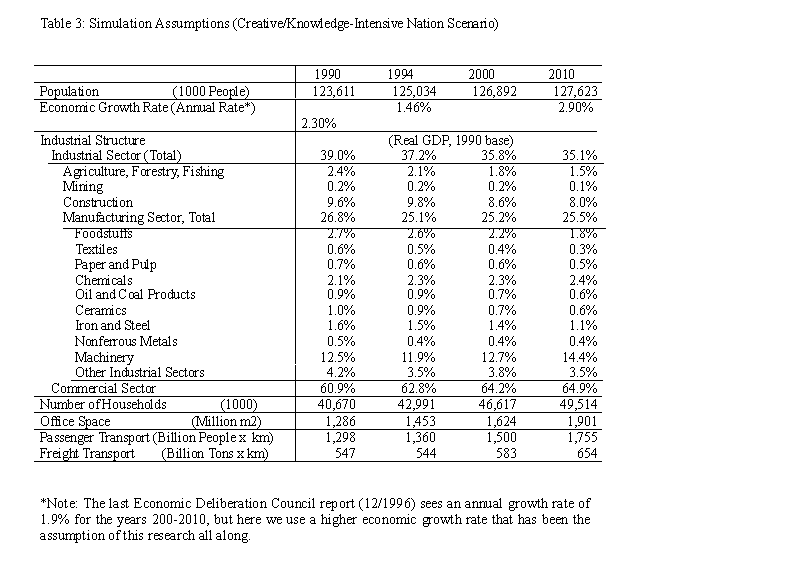
Let us now assume two scenarios for Japan's future. The first scenario is one in which little structural change occurs and the usual consumption-dependent lifestyle as well as the existing manufacturing productive activities are maintained as much as possible. Let us call this scenario the "contemporary materialistic nation scenario". The other scenario is one where the Japanese social structure undergoes a great shift toward a production system and lifestyle that takes intellectual activities seriously, and we assume that structural change occurs on a great scale. We call it the "creative/ knowledge-intensive nation scenario".
If one assumes for each of these cases a scenario with parameters like an economic growth rate, an industrial structure and shipments, necessary office space, and extent of transportation as depicted in Tables 2 and 3, what amount of CO2 will be emitted? On the basis of these assumptions, we conducted the computer simulation analysis.
Quick Reduction Measures Are Necessary
First, we determined what amount of energy services will be necessary for the two cases, and summed up the details of individual energy-using processes and determined what kind of technologies will be chosen in the market to meet the demand for these services. Figure 5 shows the future perspective of CO2 emissions for the "contemporary materialistic nation scenario" and the "creative/knowledge-intensive nation scenario".

If consumers and firms do not acknowledge the merit of fuel savings through energy saving and new technology does not spread (frozen efficiency case), CO2 emissions will increase by 26% by the year 2010 in comparison with 1990 for the "contemporary materialistic nation scenario" and 24% for the "creative/knowledge-intensive nation scenario".
If the cheapest technology spreads based on the market principle (profitable potential case), the increase of CO2 emissions will be between 13% to 15%. Even if the energy-saving technology is somewhat expensive, the spread of the technology proceeds because it is possible to recover the costs through fuel savings in a short period of time. However, the computer model used does not take into account information imperfections in the market and other social factors, and thus it is possible that it overestimates the energy efficiency improvement. One must therefore assume that the actual amount of CO2 emissions will be higher than this estimate.
In either case, if no special countermeasures such as government intervention occurs, the amount of CO2 emissions will continue to increase. Quick actions are necessary to stabilize and reduce CO2 emissions.
How Much Can CO2 Emissions Be Reduced?
How much can CO2 emissions be reduced through countermeasures? Without decreasing the production level and lowering the living standards as assumed in the two scenarios, we used the same model to simulate to what extent CO2 emissions can be reduced just by introducing efficient technology. To be precise, in respect to energy-saving and recycling technology that are not market competitive with the predicted energy prices, we propose a carbon tax of, for instance, 30,000 yen (US$240) per ton of carbon to promote the technology. However. if we assume that this tax is returned to firms and households to introduce energy-saving and recycling technology, a carbon tax of 3,000 yen (US$24) per ton of carbon would be sufficient. This would mean a burden of 2 yen (US$0.016) per liter of gasoline and would accelerate the introduction of energy-saving technology across various fields.
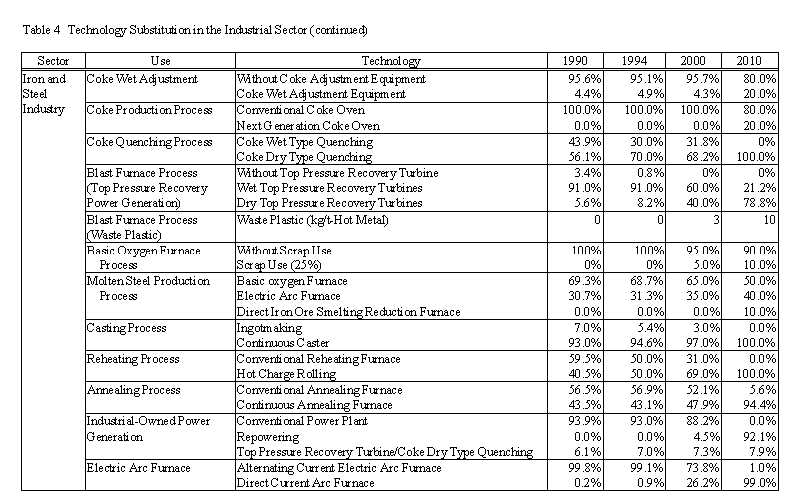
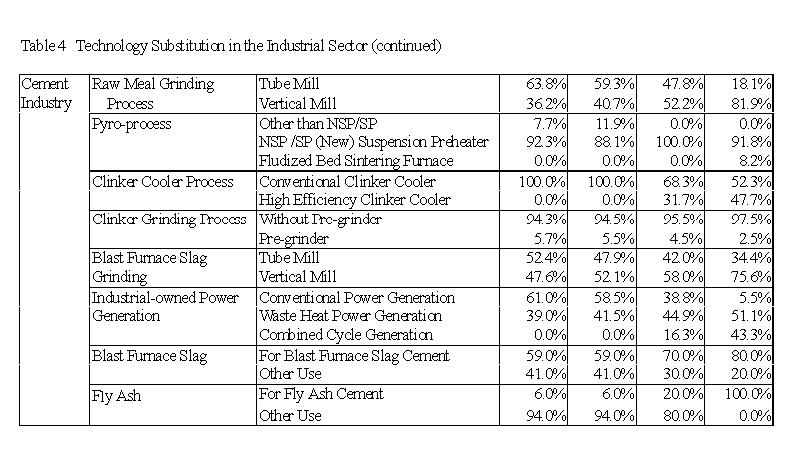
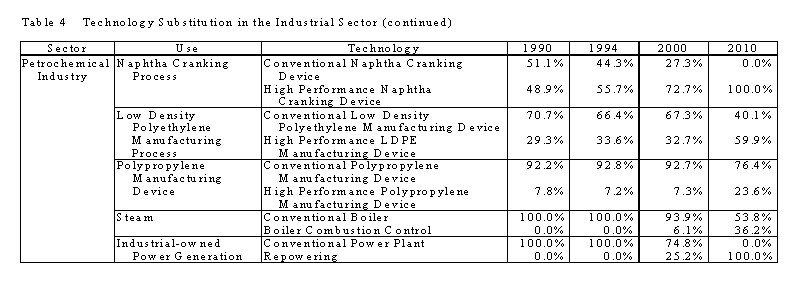
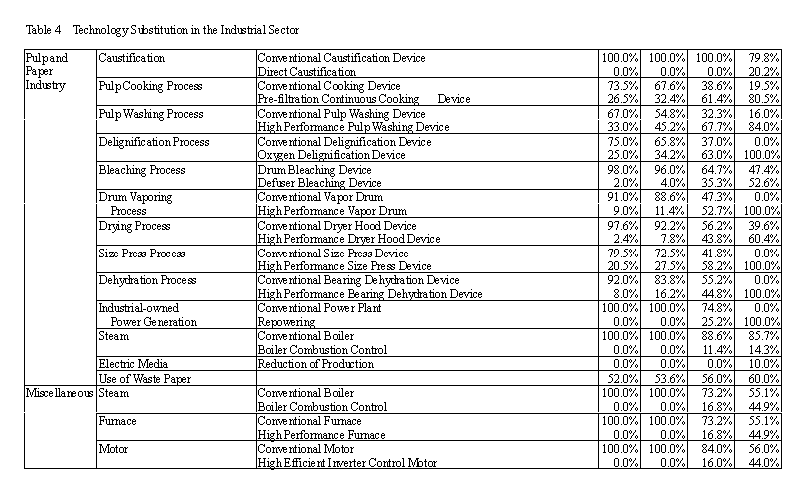
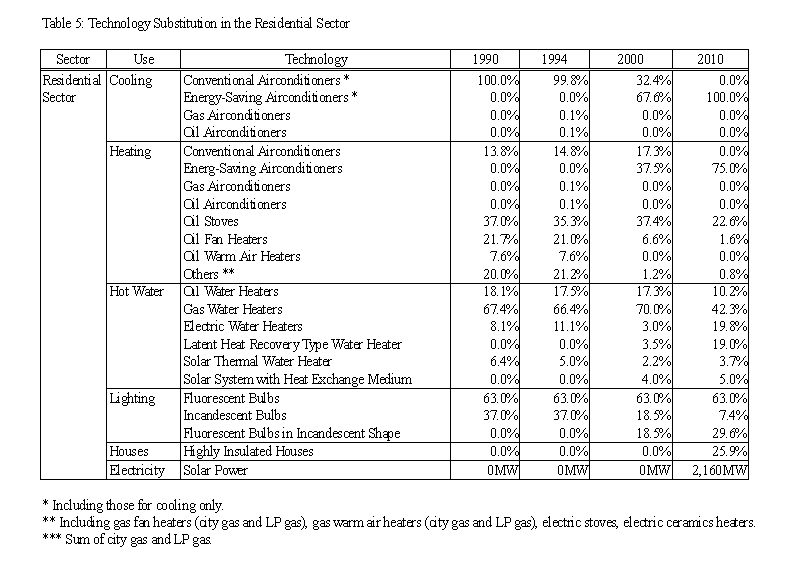
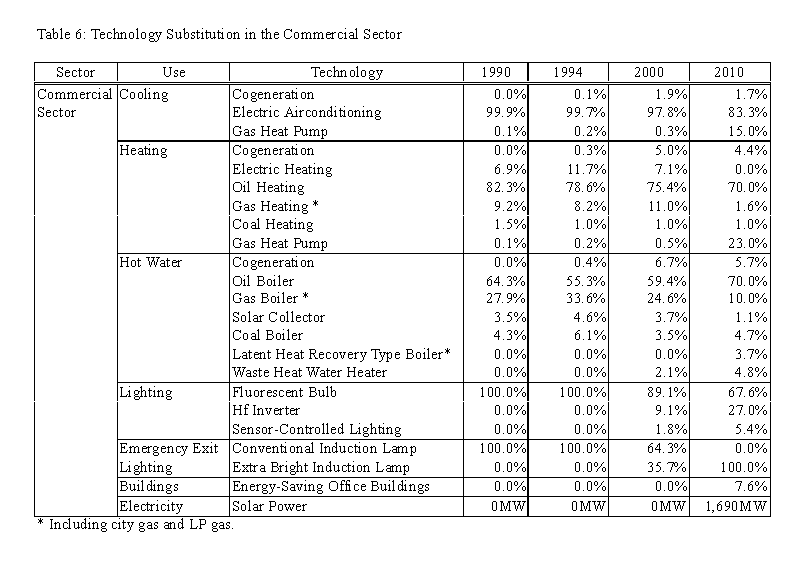
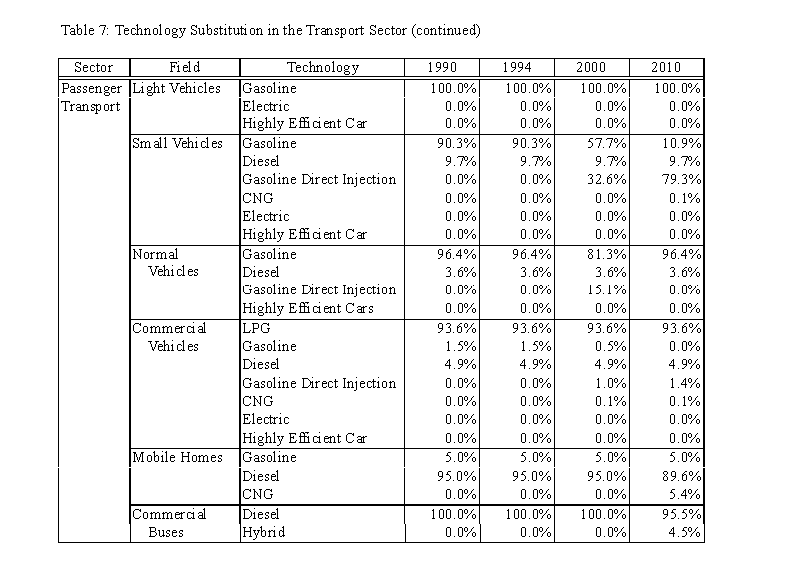
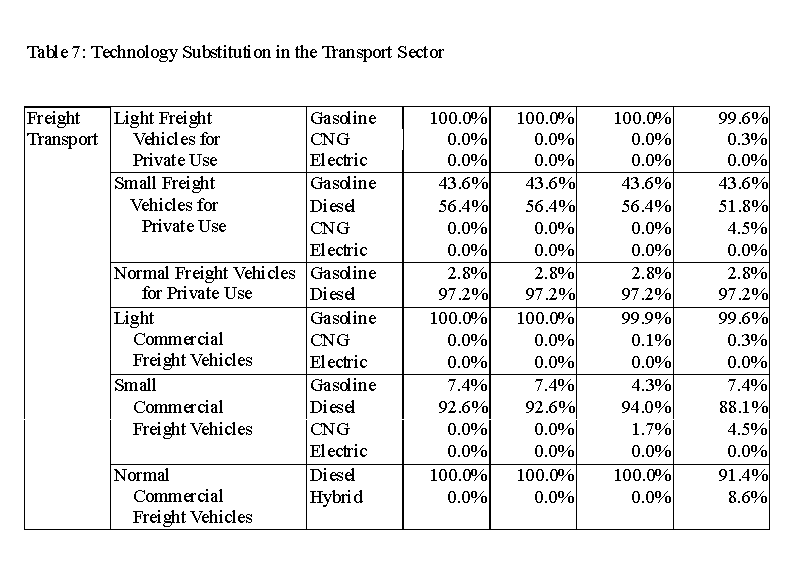
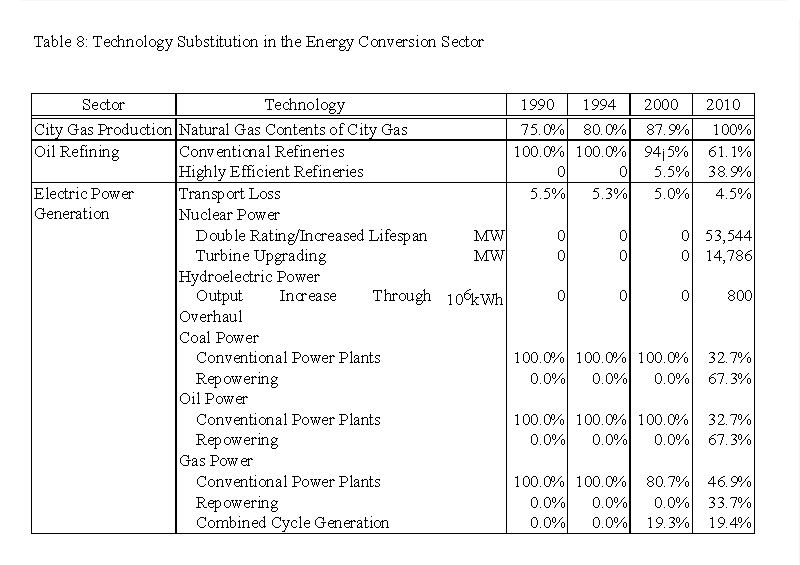
Through such measures, it becomes possible to reduce CO2 emissions by the year 2010 by 7.6% as compared to 1990 level for the "creative/knowledge-intensive nation scenario." For the "contemporary materialistic nation scenario," a possible reduction of 6.1% was indicated. For each sector, Tables 4-1, 4-2, 4-3, 4-4, 5, 6, 7-1, 7-2 and 8 show the technology substitution that can occur in energy consumption use and production. Even without decreasing productive activities and lowering standards of living, a CO2 reduction is possible.
However, to stop global warming, if one asks for a larger reduction, one cannot help decreasing the productive activities and standards of living of our country. To evade this, it becomes necessary to introduce new mechanisms such as joint implementation. Another important aspect to use the AIM end-use model is to consider measures for simultaneously reducing CO2 emissions and local air pollutants.
7 Conclusion
It is possible to decrease CO2 emissions without scaling back productive activity or standards of living in Japan. However, if one relies on the market mechanism alone, it cannot be done. Our analysis has clearly shown that it is indispensable to introduce new policies and measures such as carbon tax and subsidies.
If one tries to reduce CO2 emissions even further, the necessary costs will certainly become larger. These are certainly costs for the firms and households that have to bear the burden of reducing CO2 emissions. However, it is an increase of effective demand for the producers of energy-saving technology. It is estimated that the indirect cost for Japan as a whole will be extremely small through energized environmental industries. The business opportunities for environmental industries will increase moreover as projects to reduce CO2 emissions jointly with developing countries will be implemented.
The likelihood is high that in the next century, social-structural change will transform our society from a "contemporary materialistic nation" to a "creative/knowledge-intensive nation." This transformation will make it relatively easier to control CO2 emissions and take countermeasures to protect global environment. One could say that the social system of Japan is changing so that it will be advantageous to introduce environmental policies.
Acknowledgment
This research is funded by the Environment Research Program of the Japan Environment Agency. We are grateful to Masaya Yoshida, Go Hibino and Hisaya Ishii of the Fuji Research Institute Corporation, and Kenta Mizuno of Wakatake Company for their extensive supports.
References
- Agency of Natural Resources and Energy, Ministry of International Trade and Industry (ed.) (1996) Long-term Energy Supply-demand Outlook, Research Institute of International Trade and Industry, Tokyo, Japan (in Japanese).
- AIM Project Team (1995) Long Term Global Scenarios based on the AIM model, AIM Interim Paper, IP-95-03.
- AIM Project Team (1996) A Guide to the AIM/ENDUSE Model -Technology Selection Program with Linear Programming-, AIM Interim Paper, IP-95-05. (PDF/1,310KB)
- China's Project Team of AIM/EMISSION MODEL (1996) Application of AIM/Emission Model in P.R. China and Preliminary Analysis on Simulated Results, AIM Interim Paper, IP-96-02, January.
- AIM Project Team (1996) An Estimation of a Negotiable Safe Emissions Corridor based on the AIM Model - Preliminary Study -, AIM Interim Paper, IP-03.
- AIM Project Team (1997) Asian-Pacific Integrated Model, 83p, AIM Project Team.
- AIM Project Team (1997) Long-term CO2 Emission Outlook in Japan, AIM Interim Paper, IP-97-03.
- Economic System Council for Assessing Global Warming (1996) The Third Report on Economic System to Tackle Global Warming, Japan Environment Agency (in Japanese).
- Energy Data and Modeling Center (1996) Model Analysis on Japanese Long-term Energy Supply and Demand, Energy Conservation Center, Tokyo, Japan (in Japanese).
- Hibino, G., M. Kainuma, Y. Matsuoka and T. Morita (1996) Two-level Mathematical Programming for Analyzing Subsidy Options to Reduce Greenhouse Gas Emissions, IIASA working paper, WP-96-129, IIASA, Austria.
- Institute of Population Problems, Ministry of Health and Welfare (1992) Population Projects in Japan, Statistical Association of Health and Welfare (in Japanese).
- Institute of Social Welfare and Population Problems (1997) Population Projects in Japan (in Japanese).
- Japan Environment Agency (1996) Reports on Technologies for Preventing Global Warming, paper presented to Council on Evaluating Technologies for Preventing Global Warming (in Japanese).
- Kainuma, M., Y. Matsuoka and T. Morita (1995) End-use Energy Model for Analyzing Policy Options to Reduce Greenhouse Gas Emissions, IIASA WP-95-121, IIASA, Austria.
- Matsuoka, Y., M. Kainuma and T. Morita (1995) Scenario analysis of global warming using the Asian Pacific Integrated Model (AIM), Energy Policy, 23(4/5), 357-371.


